


Ecommerce Analytics for Multi-Platform Sellers: Why Your Business Needs More Than Platform-Native Reports


Discover why your multi-platform business needs more than native reports; leverage comprehensive eCommerce analytics for a unified, profitable strategy.
You’re running a thriving online business selling handmade jewelry. You’ve got your Etsy shop humming along, your Shopify store picking up steam, and you’ve even dipped your toes into Amazon’s massive marketplace.
Sales are rolling in from all directions, and life is good. But here’s the thing – when someone asks you a simple question like “Which product is your bestseller overall?” or “What’s your actual profit margin this month?”, you find yourself scrambling between three different dashboards, trying to piece together a coherent answer.
Sound familiar? If you’re nodding your head right now, you’re definitely not alone. Welcome to the wonderful, chaotic world of multi-platform ecommerce – where the opportunities are endless, but the analytics? Well, that’s a whole different story.
What is Ecommerce Analytics (And Why Should You Care)?
Let’s start with the basics. Ecommerce analytics is essentially your business’s report card – but way more detailed and infinitely more useful than anything you got in school. Think of it as the collection and analysis of data that tells you exactly what’s happening in your online business.
We’re talking about tracking everything from how many people visit your store, to what they’re buying, when they’re buying it, how much they’re spending, and even why they might be leaving without making a purchase.
Core data points include:
- Sales revenue and transaction volumes
- Customer behavior and buying patterns
- Inventory levels and product performance
- Marketing campaign effectiveness
- Profit margins and costs
- Traffic sources and conversion rates
ecommerce analytics like Putler tells you how your business is performing and where you need to focus your energy.
Why Analytics Are Absolutely Critical for Online Sellers
Here’s where things get real. According to recent studies, companies that make data-driven decisions are 5-8 times more likely to see higher ROI compared to those flying blind. That’s not a small difference – that’s the difference between thriving and just surviving.
The Real Cost of Flying Blind
When you’re making business decisions without proper analytics, you’re essentially driving with your eyes closed. Sure, you might not crash immediately, but you’re definitely not going to reach your destination efficiently. Here’s what typically happens:
- Wasted marketing spend – You keep pumping money into ads that aren’t actually profitable
- Inventory disasters – You stock up on products that don’t sell while running out of your actual bestsellers
- Missed opportunities – You can’t spot trends or capitalize on what’s working
- Burnout – You work harder, not smarter, because you don’t know where to focus your efforts
What Each Platform Offers
Now, let’s talk about what you’re currently working with. Each major ecommerce platform does provide analytics, and to be fair, they’re not terrible – they’re just incomplete when you’re playing in multiple sandboxes.
Shopify Analytics
Shopify’s built-in analytics are pretty solid for a single-platform business. You get:
- Sales reports showing revenue, orders, and trends
- Customer analytics tracking returning vs. new customers
- Product performance data showing your bestsellers
- Marketing reports breaking down traffic sources
- Financial summaries with basic profit calculations
The dashboard is clean, the data is reliable, and for a Shopify-only business, it covers most bases. The problem? It only sees what happens on Shopify.
Amazon Seller Central
Amazon doesn’t mess around with data. Their Seller Central provides:
- Business reports with detailed sales analytics
- Advertising reports tracking your sponsored product performance
- Inventory management tools with reorder recommendations
- Customer behavior insights showing search terms and buying patterns
- Financial statements breaking down fees and profits
Amazon’s analytics are incredibly detailed because, well, they’re Amazon. They’ve been perfecting data collection for decades. But again, it’s only Amazon data.
Etsy Shop Stats
Etsy keeps things simple but effective:
- Traffic stats showing views and visits
- Revenue tracking with basic sales data
- Customer insights including repeat buyer information
- Search analytics revealing how customers find you
- Market trends specific to your niche
Perfect for understanding your Etsy performance, but it exists in its own little bubble.
eBay Seller Hub
eBay’s analytics focus on their unique marketplace dynamics:
- Sales performance tracking across auction and fixed-price formats
- Traffic reports showing listing views and watchers
- Pricing insights comparing your prices to competitors
- Shipping analytics tracking delivery performance
- Fee breakdowns showing where your money goes
Again, solid for eBay-specific insights, but doesn’t talk to your other platforms.
BigCommerce Reporting
BigCommerce offers robust analytics including:
- Advanced reporting with customizable dashboards
- Customer segmentation tools for targeted analysis
- Product performance tracking with profitability insights
- Marketing attribution showing channel effectiveness
- Real-time data for immediate decision-making
Great features, but still limited to BigCommerce transactions.
The Multi-Platform Reality Check
Here’s where things get interesting – and by interesting, I mean potentially frustrating if you’re trying to run a cohesive business strategy.
Let’s say you’re selling on three platforms: Shopify, Amazon, and Etsy. Your morning routine probably looks something like this:
- Check Shopify – “Great! 15 orders overnight, and that new t-shirt design is selling well”
- Switch to Amazon – “Hmm, 8 orders here, and apparently, phone cases are my top seller?”
- Jump to Etsy – “12 orders, and customers love my handmade journals”
By 9 AM, you’ve got three different “realities” of your business performance. Which one is true? Well, they all are – but none of them show you the complete picture.
The Data Silo Problem
This is what we call the “data silo” problem. Each platform is like a separate room in your house – you know what’s happening in each room, but you can’t see the whole house at once.
Imagine trying to understand your family’s daily routine by only checking one room at a time. You might think everyone loves spending time in the kitchen (because that’s where you checked first), but you’re missing the fact that they actually gather in the living room most evenings.
The Time Drain Reality
Let’s talk about the elephant in the room: time. If you’re manually checking multiple platforms daily, doing the math to combine sales figures, and trying to reconcile inventory across channels, you’re probably spending 2-3 hours a day just on basic reporting.
That’s 15-20 hours a week – basically a part-time job – just to understand how your business is performing. Time you could be spending on product development, marketing, or actually, you know, living your life.
The Shortcomings of Native Analytics: Where They Fall Short
Alright, let’s get into the nitty-gritty of why relying solely on native platform analytics is like trying to solve a jigsaw puzzle with pieces from three different boxes.
1. Limited Cross-Platform Visibility
This is the big one. Native analytics are like having tunnel vision – they only see their own little corner of your business universe.
2. No Unified Customer Journey Tracking
Here’s something that’ll blow your mind: the same customer might discover you on Instagram, check out your products on Amazon, compare prices on your Shopify store, and finally make a purchase on Etsy.
3. Incomplete Financial Picture
Each platform calculates fees differently, handles refunds uniquely, and processes payments on different schedules. Trying to get an accurate picture of your actual profitability by looking at native analytics is like trying to balance your personal checkbook by only looking at your credit card statements.
4. Lack of Comparative Analysis
Want to know which platform gives you the best ROI? Which products perform better on which channels? Which marketing efforts are most effective across your entire business? Native analytics simply can’t answer these questions because they don’t talk to each other.
5. Missing Advanced Insights
Native platforms focus on their own metrics and goals, which don’t always align with yours. They might show you data that helps them (like encouraging you to spend more on their advertising), but miss insights that would help your overall business strategy.
For instance:
- You can’t easily identify which platform has the highest customer lifetime value
- You can’t track which channels your most profitable customers come from
- You can’t see seasonal trends across your entire business
- You can’t identify cross-selling opportunities between platforms
6. Inconsistent Metrics and Reporting
Ever notice how each platform defines “conversion rate” slightly differently? Or how they handle returns and refunds in their reporting? These inconsistencies make it nearly impossible to compare performance across platforms accurately.
It’s like trying to compare your height when one person measures you in feet, another in centimeters, and the third includes your shoes. The numbers don’t lie, but they don’t tell the same story either.
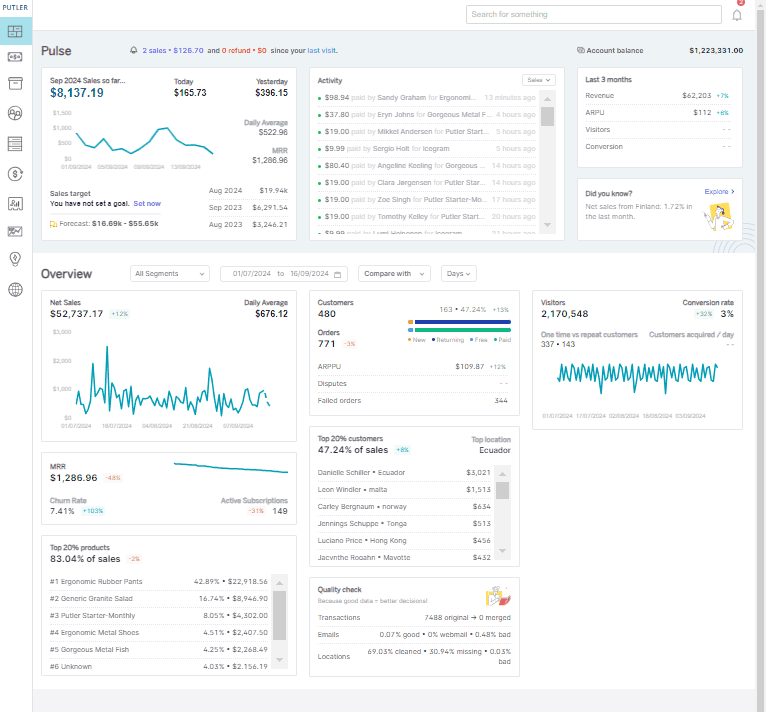
Meet Putler: eCommerce analytics
Okay, so we’ve talked about the problem – now let’s talk about the solution that’s actually changing the game for thousands of multi-platform sellers worldwide.
When one of my friend started using Putler, she connected her Shopify store, Etsy shop, PayPal account, and Stripe payments all in one place. For the first time in three years of running her business, she could see her complete revenue picture.
Putler integrates with 17+ platforms, including:
- Ecommerce platforms: Shopify, WooCommerce, BigCommerce, Etsy, eBay
- Payment gateways: PayPal, Stripe, Braintree, 2Checkout
- Analytics: Google Analytics
- Email marketing: MailChimp
- And more: Plus custom API integration for anything else you use
Data Cleaning & Deduplication
Here’s where Putler gets really clever. It doesn’t just pull in your data and slap it together – it actually cleans and deduplicates everything.
It also handles all those annoying discrepancies like:
- Different time zones across platforms
- Multiple currencies (automatically converted)
- Varying transaction statuses (pending, completed, refunded)
- Platform-specific fee calculations
Think of it like having a super-smart accountant who speaks fluent Shopify, PayPal, and Amazon, then translates everything into plain English for you.
The Features That’ll Make You Wonder How You Lived Without Them
Instant Search: Need to find a specific order or customer? Putler’s search finds anything in seconds. No more hunting through multiple platforms.
Quick Refunds: Issue refunds directly from Putler without logging into PayPal or Stripe. Your support team will love you for this one.
Sales Heatmaps: Visual heat map showing your hottest selling times – discover exactly when your customers are most likely to buy, down to the hour.
RFM Customer Segmentation: Automatically sorts customers into 11 smart segments (Champions, At Risk, Lost, etc.) based on buying behavior for targeted marketing.
Goal Tracking: Set revenue targets and track progress in real-time. Perfect for keeping your team motivated and on track.
Forecasting: Based on your actual sales data, Putler predicts future revenue. It’s like having a crystal ball that actually works.
Team Collaboration: Share insights with your team without giving everyone access to your payment accounts. Smart and secure.
Ready to See Your Business Clearly?
If you’re tired of piecing together fragments of data from different platforms, if you’re ready to stop making decisions based on incomplete information, and if you want to finally see the true potential of your multi-platform business, Putler’s 14-day free trial is the perfect place to start.
No credit card required, no commitment, just pure clarity about your business performance.
Was this news helpful?
 Yes, great stuff!
 I’m not sure
 No, doesn’t relate